
Thermal Drone DJI Mavic 3 T
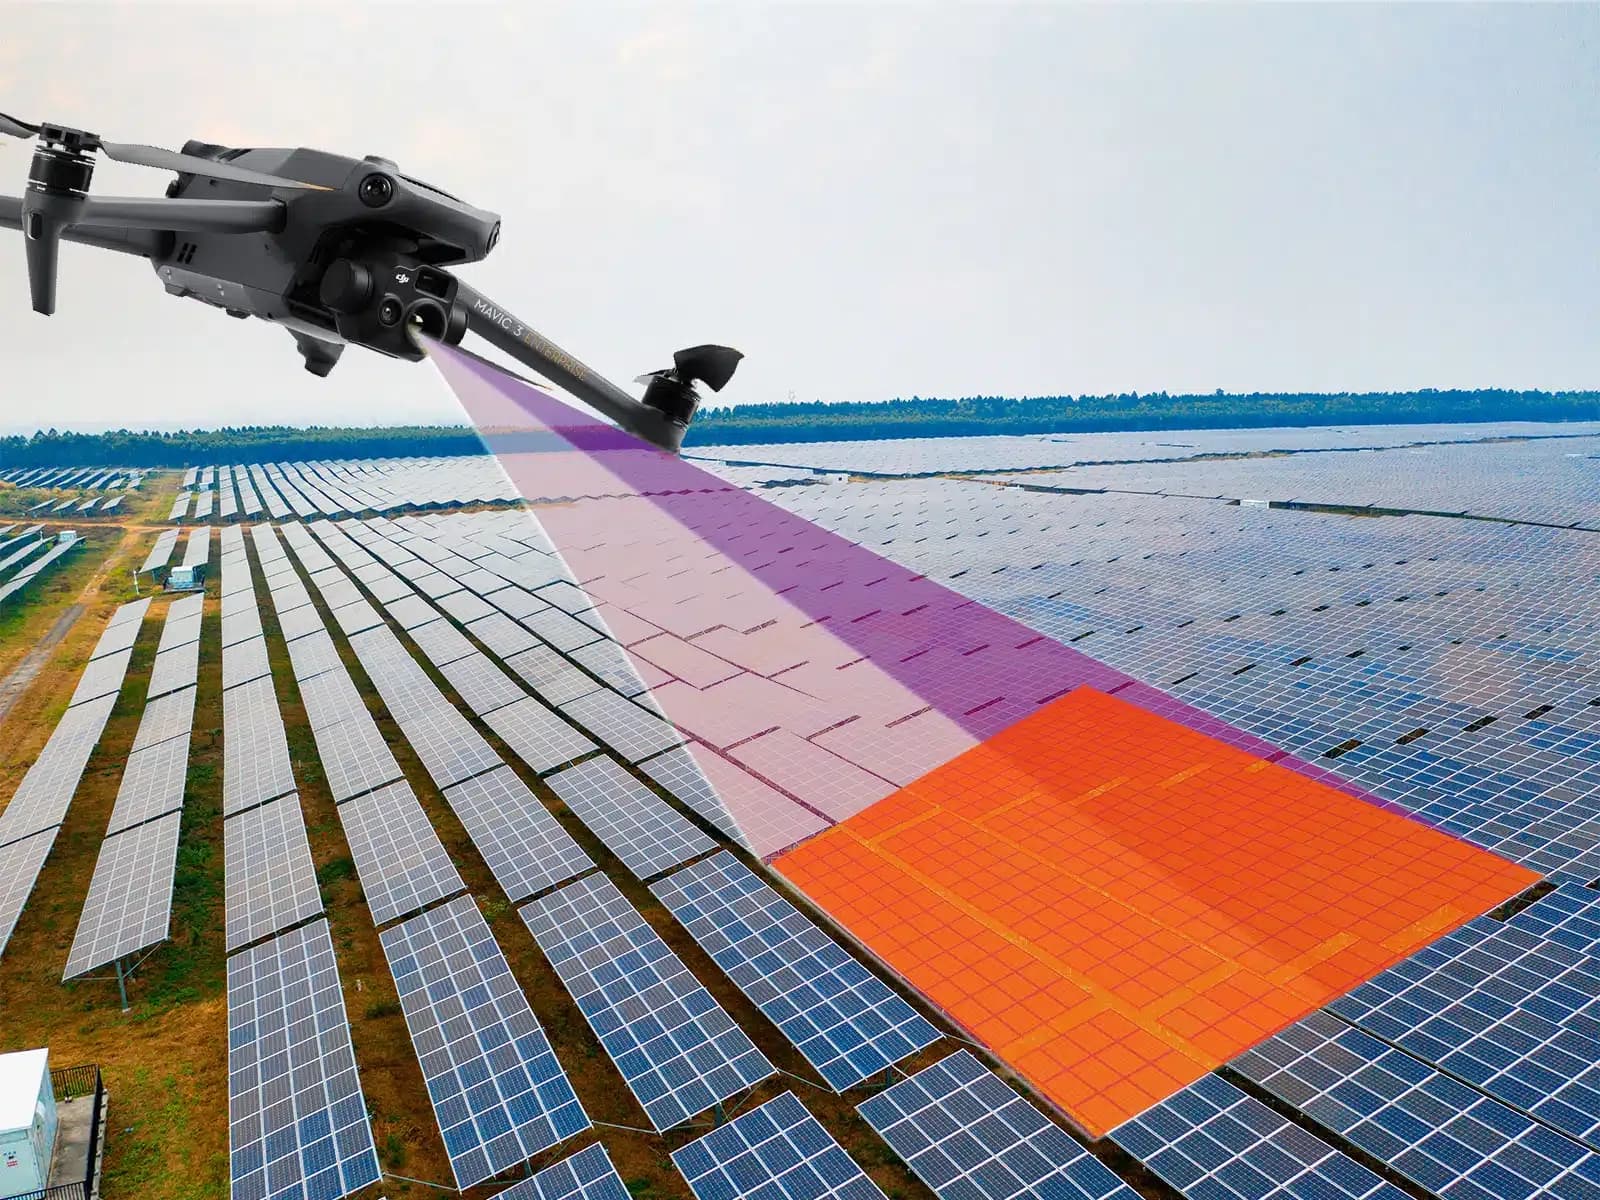
Thermal drone DJI Mavic 3 T: thermal and visible drone imagery can document apparent module condition and suspected anomalies on PV sites.
Why This Class of Thermal Drone Is Used on PV Sites
A compact enterprise thermal drone such as the DJI Mavic 3 T class combines aerial mobility with thermal and visible imaging in one aircraft. For PV inspection, that makes it possible to screen module rows from above while preserving visual context and location information that can later be associated with specific parts of the plant.
The aircraft is useful because solar sites often contain repeated modules distributed over large areas. Instead of beginning with a detailed ground inspection of every row, an aerial survey can identify modules, strings, or equipment areas whose visible or thermal behavior differs from suitable comparison areas.
The usefulness of the platform should not be confused with proof of a defect. Camera specifications, flight stability, positioning, route control, environmental conditions, and inspection procedure all influence the quality of the resulting evidence.
Model choice is therefore only one part of the inspection system. The same aircraft can produce useful or poor data depending on flight height, viewing angle, irradiance, wind, focus, target resolution, and the competence of the person reviewing the results.
The decision to use this class of drone should follow the site and inspection objective rather than the product name itself.
What a Thermal Survey Flight Produces
A thermal survey can produce thermal imagery, visible photographs, location metadata, flight records, and other data associated with the aircraft and camera configuration. These sources can be combined to create a reviewable record of modules and equipment observed during the flight.
Thermal imagery represents surface temperature behavior. It can show localized warm or cool regions, differences between neighboring modules, and patterns that may be associated with cells, bypass-diode behavior, connections, shading, circuit state, or other operating conditions.
Visible imagery supplies a different type of evidence. Broken glass, contamination, vegetation, shadows, damaged frames, displaced equipment, and other physical conditions may be easier to understand from a normal photograph than from a thermogram.
Flight metadata helps preserve traceability. A finding is more useful when a reviewer can determine which row, module area, string, or component produced the image and when it was captured.
The dataset should also record limitations. If some rows were obscured, image resolution was insufficient, weather changed, or the aircraft could not operate in part of the site, those gaps should remain visible in the inspection record.
Thermographic Inspection on Solar Sites: How a Survey Runs
The survey begins by defining what needs to be found. Module-level screening, cell-level thermal review, connector inspection, and broad site documentation can require different flight heights, routes, and image densities. The target feature should determine the acquisition plan.
Environmental conditions are then assessed. IEC 62446-3 addresses outdoor thermographic inspection of operating PV systems, including equipment, environmental conditions, inspection procedure, personnel competence, and reporting. It does not prescribe one universal module-temperature range for every plant and does not define a software detection algorithm.
During flight, the aircraft should maintain geometry that supports the intended spatial resolution and limits problematic reflections. Flight height, speed, camera angle, route, and image overlap influence whether the final dataset contains enough information for review.
Irradiance, wind, cloud movement, and module temperature should be considered throughout acquisition. A route completed under rapidly changing conditions can contain images that are difficult to compare even when every module was technically photographed.
After flight, the imagery is organized by location and reviewed. Candidate findings are separated from obvious reflections, poor captures, cloud transitions, or other acquisition artifacts before ground verification is planned.
What Faults and Damage Thermal Data Can Point To
A localized warm cell or cell group can indicate that part of a module is operating differently from surrounding cells. Possible causes include cell damage, shading, mismatch, interconnection behavior, or another electrical condition. The image alone does not establish which mechanism is responsible.
Patterns across larger parts of a module may be associated with bypass-diode behavior or differences in current path. These patterns can be useful for identifying candidates, but the module design, electrical configuration, visible condition, and operating data should be considered before assigning a specific fault.
Connection heating can also appear in thermal imagery. Connectors, terminals, fuse holders, or other current-carrying points may operate warmer when resistance is elevated under load. Such an observation can justify targeted electrical and physical inspection.
Soiling and shading can influence thermal appearance as well. Contamination changes how sunlight reaches the cells, while shadows can alter module current and temperature. Visible imagery can help determine whether an apparent thermal difference corresponds to an external surface condition.
Thermal data therefore points toward locations and possible mechanisms. It should not convert a pattern directly into a confirmed defect without the evidence needed for that conclusion.
Benefits and Practical Constraints
A compact thermal drone can cover many module rows without requiring personnel to walk every section during the first stage of inspection. This may reduce unnecessary field movement and make it easier to localize findings on large or regularly arranged sites.
Route repeatability is another useful capability. Reusing similar paths, altitude, and camera geometry can make later surveys easier to organize. Comparable routes do not make measurements automatically equivalent, because weather and electrical operating conditions may still differ.
Wind limits both flight operation and thermographic usefulness. Even when the aircraft remains controllable, increased convective cooling can alter surface-temperature differences. Cloud movement and rapidly changing irradiance can create additional comparison problems.
Flight permissions, nearby infrastructure, people, site procedures, and local aviation requirements may also limit when or where a survey can occur. These constraints need to be assessed for the actual location rather than inferred from the aircraft's technical capabilities.
Battery endurance influences how often the aircraft must return or change batteries, but there is no single guaranteed survey duration. Site area, route density, weather, launch locations, target resolution, and operating reserve all affect practical flight time.
The benefit of using the drone is therefore site-dependent. Coverage, access, and repeatability can be valuable without implying a fixed saving in time or cost.
From Flight Data to Reviewed Findings
After collection, the first task is to connect imagery to physical assets. Row, block, string, module, or equipment identifiers make the observation usable by technicians who need to inspect the location on the ground.
The review process should initially create candidate findings. A reviewer or software system may flag a localized hot area, unusual module pattern, connector heating, or another difference from suitable comparison equipment. That candidate is not yet a confirmed root cause.
Human review is needed to check reflections, viewing geometry, cloud transitions, image quality, focus, shading, and other influences. Visible imagery and plant monitoring data can provide additional context before the finding is sent for field verification.
Where the maintenance decision requires an electrical property, direct testing follows. Current, voltage, insulation resistance, continuity, IV measurements, connector examination, or other procedures can confirm or reject the suspected mechanism.
The final report should preserve the chain from captured image to reviewed observation and, where available, confirmed field result. This keeps image classification separate from diagnosis.
Software can help with mapping, candidate detection, comparison, and record preparation. It does not replace electrical testing, qualified interpretation, or the person responsible for the inspection conclusion.
Limits
Thermal data cannot prove root cause on its own. A similar temperature pattern can result from more than one physical or electrical condition, and some defects may produce little or no detectable thermal contrast during the flight.
One flight is also not continuous monitoring. The plant is observed only during the survey window, so intermittent problems may be absent and new conditions may develop afterward. Monitoring data and later inspections remain relevant.
The selected drone model does not determine diagnostic quality by itself. A capable camera flown at unsuitable altitude, in poor conditions, or with inadequate review can produce less useful evidence than simpler equipment used with a better procedure.
Thermography also does not replace insulation testing, current and voltage measurements, continuity tests, IV analysis, polarity checks, or other electrical procedures where those measurements are needed.
IEC 62446-3 provides a framework for outdoor thermographic inspection of operating PV systems, covering equipment, environment, procedure, personnel competence, and reporting. It does not make a particular drone model compliant or convert software output into a conformity decision.