
How to Calculate Solar Power Plant Production
How to calculate solar power plant production using installed capacity, irradiance, performance ratio, system losses and measured energy yield.
Production Calculation Basics
Solar plant production is energy generated over a period of time, usually expressed in kilowatt-hours or megawatt-hours. Installed PV capacity, by contrast, is power and is commonly expressed in kilowatts peak or megawatts peak. These quantities are related, but they are not interchangeable.
Energy = Installed capacity × Equivalent solar irradiation hours × Performance factor
If installed capacity is in kW and the equivalent irradiation term is expressed in kWh/m² relative to the standard irradiance basis, the resulting energy is commonly interpreted in kWh after the model's normalization and loss assumptions are applied. In detailed yield modeling, plane-of-array irradiance, module characteristics, temperature, inverter behavior, and loss terms are normally treated explicitly rather than compressed into one factor.
Annual energy (kWh) = Installed capacity (kWp) × Specific yield (kWh/kWp)
Specific yield represents modeled or measured energy per unit of installed capacity over the chosen period. It is not a universal constant and changes with location, system design, weather, equipment, and losses.
Any production calculation should therefore state the period, irradiance source, installed capacity basis, loss assumptions, and whether the result is modeled or measured.
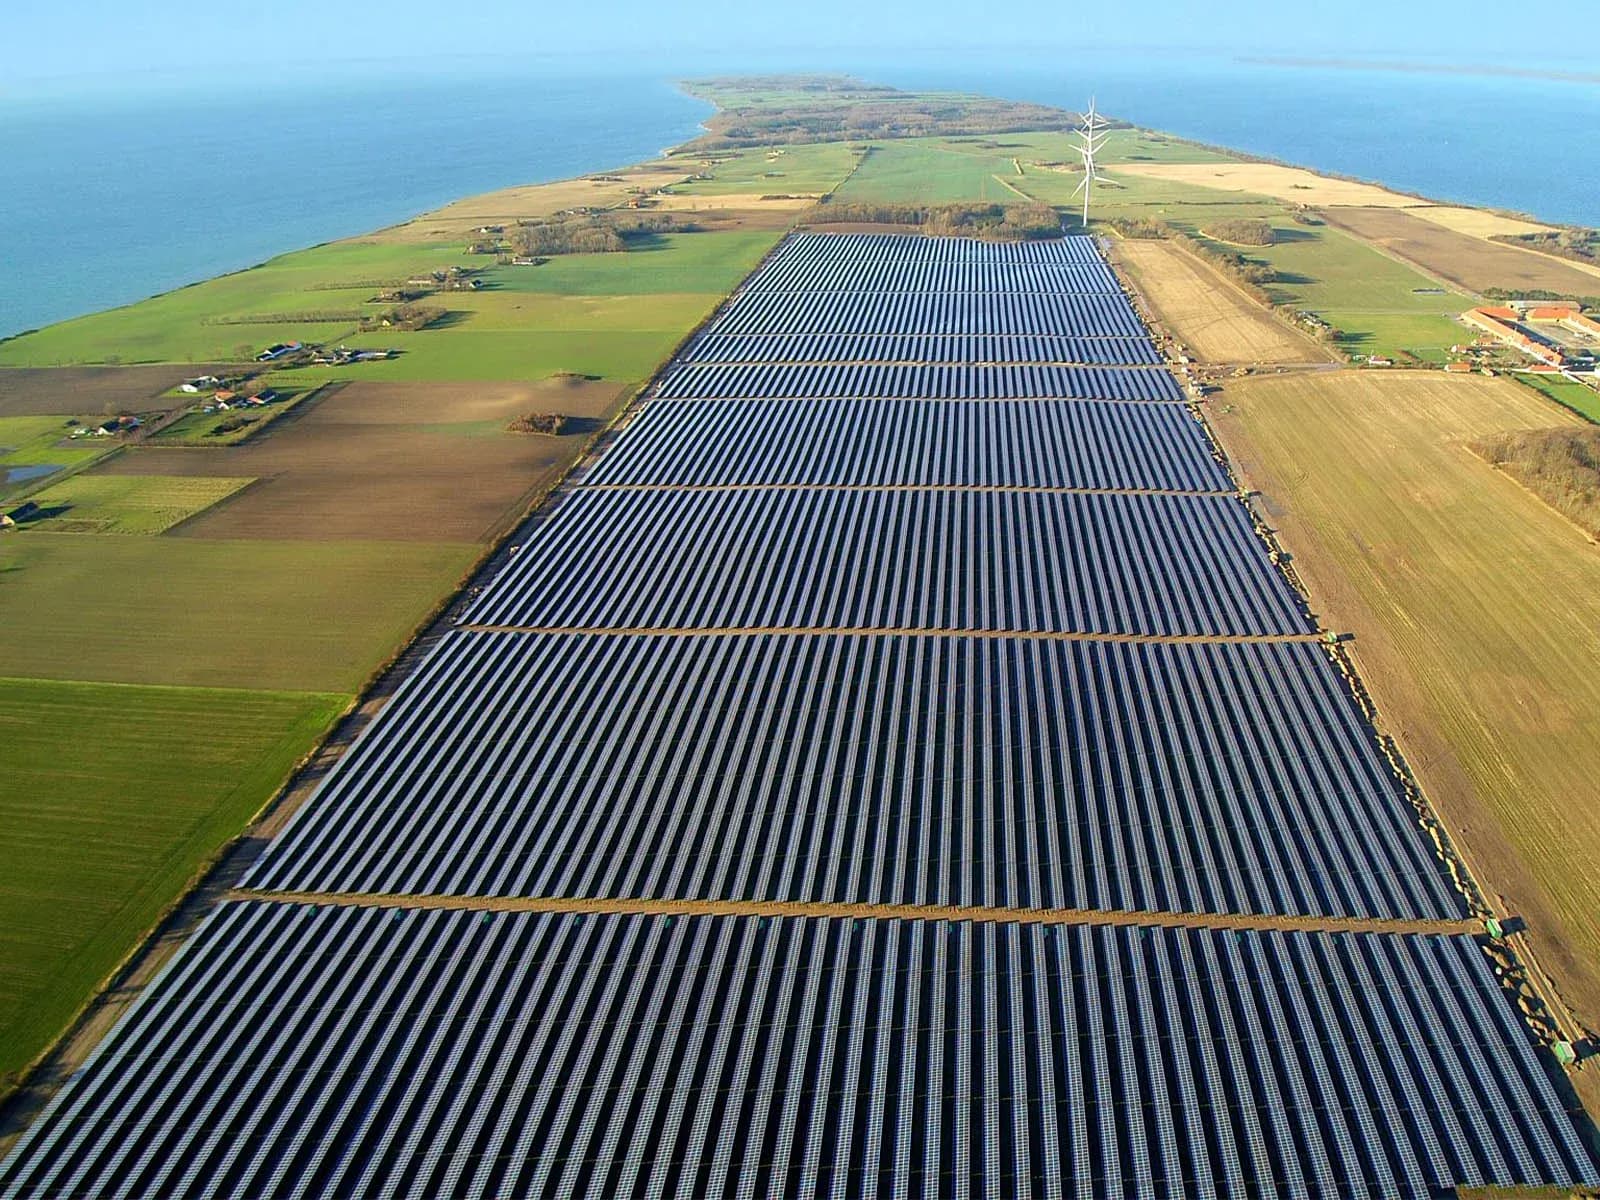
Why Capacity Is Not Daily Production
A plant rated at 1 MW does not generate 1 MWh every hour of the day. Megawatts describe instantaneous power capability under specified conditions, while megawatt-hours describe energy accumulated over time.
A simple example shows the distinction. If a 100 kW PV system produced an average of 60 kW for five hours and produced no energy during the remainder of the example period, the energy would be:
That example does not mean a 100 kW system will normally produce 300 kWh per day. Actual output changes with solar irradiation, module temperature, orientation, shading, system losses, weather, inverter operation, curtailment, and other conditions.
Peak installed capacity is based on specified module test conditions, not on guaranteed field output at every moment. Real modules spend much of their operating time away from those reference conditions.
Daily production should therefore be calculated or measured as energy over time. Multiplying nameplate capacity by 24 hours would incorrectly assume that the plant produces rated power continuously through night and day.
Understanding the kW-versus-kWh distinction is essential before comparing plant size, production forecasts, meter data, or storage requirements.
Losses Between Module and Meter
Energy available at the revenue or plant meter is lower than the theoretical solar energy incident on the array because several conversion and operating effects occur between sunlight and delivered AC electricity. These effects should be represented explicitly in a detailed production model.
Shading reduces the irradiance reaching cells and can also affect series-connected modules through mismatch and bypass behavior. The impact depends on the location, duration, geometry, module architecture, string design, and inverter configuration.
Soiling reduces transmitted light when dust, pollen, bird contamination, agricultural residue, or other material accumulates on the module surface. The loss is site-dependent and changes with weather, module tilt, contamination source, and cleaning history.
Module temperature also affects output. For crystalline-silicon modules, increased cell temperature at comparable irradiance generally reduces voltage and available power. The specific effect should be calculated from the characteristics of the installed module.
Electrical losses occur in DC cables, connectors, transformers, AC circuits, and other components. Inverters introduce conversion losses and may also limit output when operating constraints or rated capacity are reached.
Curtailment or export limitation can reduce energy delivered even when the array itself could produce more. Availability, maintenance outages, grid events, equipment faults, and control settings can add further differences between theoretical and measured production.
Checking an Estimate Against Operating Data
Once the plant is operating, modeled production should be compared with measured energy and the weather conditions that actually occurred. A forecast based on long-term average irradiance should not be expected to match every individual day, month, or year exactly.
The comparison should use consistent boundaries. If the model predicts energy at the inverter output but the measured value comes from a grid meter after transformer and auxiliary losses, the two numbers do not represent the same point in the system.
Weather data is also important. Lower production during a period of lower-than-expected irradiance may indicate normal plant response rather than equipment underperformance. Conversely, good irradiance combined with unexpected production can justify investigation of availability, curtailment, temperature, soiling, inverter operation, or electrical condition.
String- or inverter-level data can help narrow the cause of deviations. If one section differs while nearby sections operate normally under similar conditions, the issue may be localized rather than caused by site-wide weather.
Inspection can then provide physical evidence. Visual checks, aerial thermography, and electrical tests can investigate specific parts of the plant identified by operating data.
Measured production should therefore be used to refine understanding of the model, not simply to label every deviation as a fault.
What Performance Ratio Does and Does Not Tell You
Performance ratio, commonly abbreviated PR, is a normalized indicator used to compare actual or modeled PV energy output with a reference based on available solar irradiation and installed capacity. A simplified representation is:
Final yield = Energy output (kWh) / Installed capacity (kWp)
and reference yield is derived from the measured or modeled solar irradiation relative to the reference irradiance used for PV ratings. PR is dimensionless and is often expressed as a decimal or percentage.
PR helps separate some effects of plant size and irradiation, making it useful for comparing operation across periods when the input data and measurement boundaries are consistent. It still includes the combined influence of temperature, system losses, availability, soiling, inverter behavior, curtailment, and other factors present in the calculation.
Performance ratio is not the same as module efficiency. Module efficiency describes how effectively incident solar power is converted into electrical power under defined conditions, while PR describes how the operating system performs relative to a normalized reference.
A change in PR also does not identify root cause by itself. Further analysis is needed to determine whether the change comes from weather data quality, soiling, temperature, equipment availability, curtailment, electrical losses, measurement error, or another factor.
Common Estimation Mistakes
One common mistake is treating installed capacity as if it were guaranteed production. A 10 MWp plant does not produce 10 MWh each hour, and multiplying capacity directly by all hours in a year ignores night, weather, temperature, and system losses.
Another mistake is using horizontal irradiation without accounting for the actual plane and orientation of the array. Tilt, azimuth, tracker movement, horizon effects, and shading influence the irradiation received by the modules.
Loss assumptions can also be applied inconsistently. Soiling, temperature, inverter conversion, wiring, availability, curtailment, mismatch, and transformer losses should not be counted twice or hidden inside several overlapping factors.
Using unrealistic weather data creates another problem. A model based on long-term climate data describes expected conditions over a statistical period, while one operating year can be sunnier or cloudier than that reference.
Measurement boundaries are frequently overlooked. Module-level DC energy, inverter AC output, plant AC collection, and grid-export meter energy are not the same quantity.
Finally, excessive precision can make an estimate look more certain than the inputs justify. A production model is only as reliable as its weather data, equipment assumptions, loss estimates, plant design, and operating assumptions.
Limits
A production calculation is an estimate until it is compared with measured operation. Even a detailed model cannot guarantee the exact amount of energy that a plant will generate in a future year because weather, availability, equipment condition, curtailment, maintenance, and grid conditions can change.
For the same reason, energy production should not be converted directly into a guaranteed financial return. Electricity price, tariff structure, operating expenses, taxes, financing, curtailment, degradation assumptions, maintenance events, and other commercial variables affect revenue.
Measured data also has limits. Sensors can drift, meters can use different boundaries, communication systems can lose records, and weather stations may not represent conditions equally across a large plant.
Thermographic inspection can help investigate some operating deviations, but it does not calculate production by itself. IEC 62446-3 addresses outdoor thermographic inspection of operating PV systems, including equipment, environmental conditions, procedure, personnel competence, and reporting. It does not define a general energy-yield calculation or one universal thermal threshold for production analysis.
The useful distinction is between model and measurement. Models estimate what the plant could produce under stated assumptions; meters record what crossed a defined measurement point. Analysis explains why those two values differ and whether the difference is consistent with the plant's actual operating conditions.