
Large Solar Power Plants: 10 Examples
Large solar power plants: 10 examples and how to compare plant capacity, project boundaries, annual generation and utility-scale maintenance needs.
The largest solar power plants cannot be compared reliably without defining the reporting date, project boundary and capacity basis. A single plant, a multi-developer solar park and a solar-plus-hydro complex are different assets. The ten projects below are notable utility-scale examples, not a verified current world top-ten ranking.
This directory preserves historically important projects while avoiding unsupported rank positions and annual-output claims. Capacity in MW measures power; electricity generated over a period is measured in MWh or GWh. Use operator or government records that identify commissioned phases and whether a figure is DC, AC or export capacity.
1. Bhadla Solar Park: India
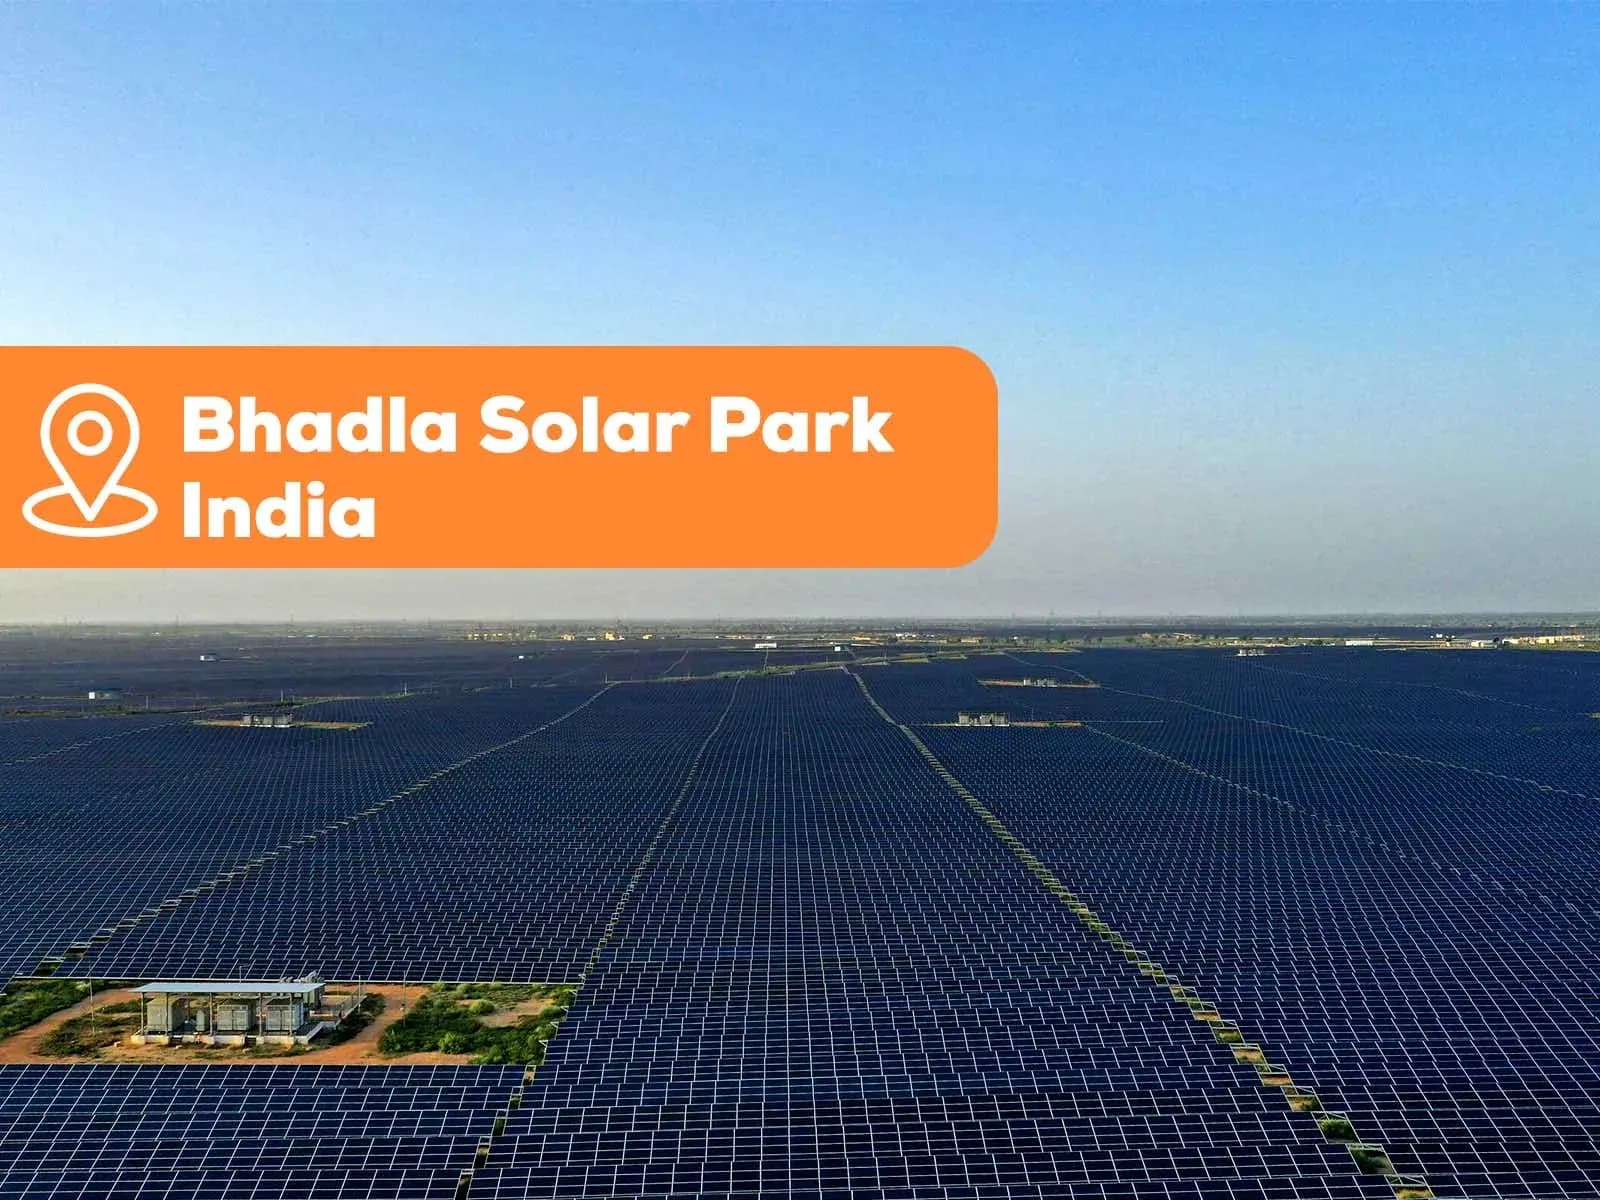
Bhadla Solar Park in Rajasthan, India, is a multi-phase development. The Indian Ministry of New and Renewable Energy’s 2017 year-end review records 650 MW commissioned in Bhadla Phase II. This dated figure describes one phase, not the whole park. Keep phase boundaries explicit when comparing its capacity with a single generating facility.
2. Tengger Desert Solar Park - China
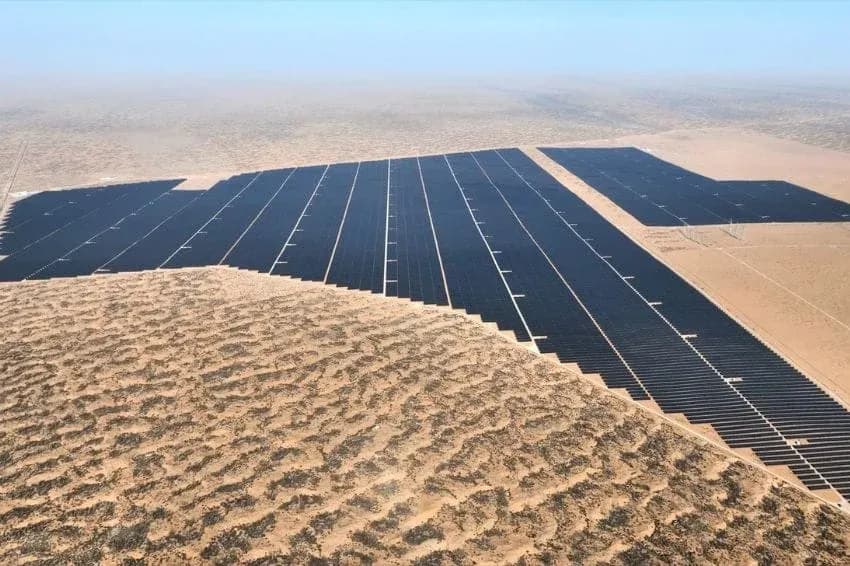
Tengger Desert Solar Park in Ningxia, China, is a large desert photovoltaic development. NASA’s Earth Observatory article of 17 June 2019 describes 1.5 GW of capacity across 43 square kilometers. The 43 figure is land area, not millions of panels; no verified panel count or annual-generation total is stated here. NASA’s description of it as the largest solar park was specific to that publication date, not a current ranking. Its capacity is not labeled AC or DC in the article. Source: NASA Earth Observatory
3. Solar Star - USA
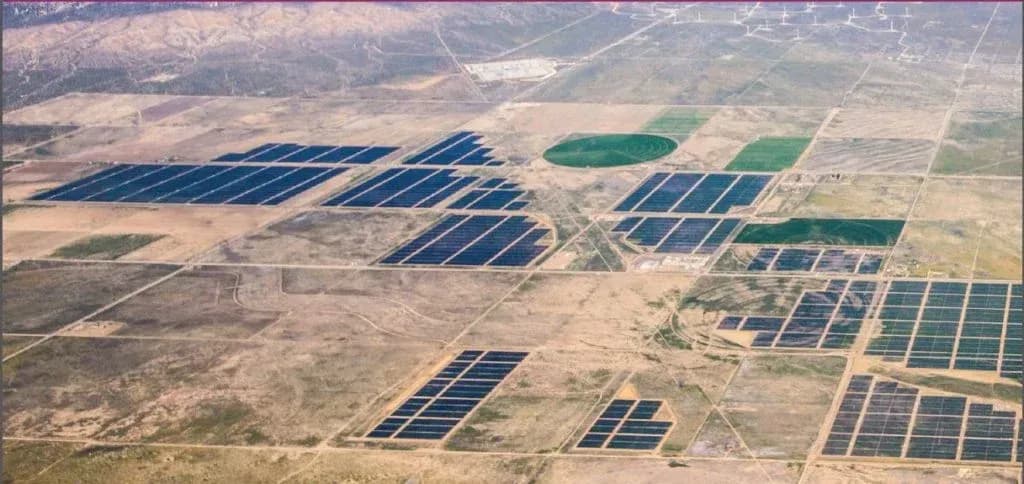
Solar Star is located in Kern and Los Angeles counties, California. BHE Renewables’ project page, checked on 19 September 2026, lists 610 MW, 1.86 million solar panels and 2015 as the operational year. The page also describes Solar Star 3 and 4 as separate solar-plus-storage developments. Its headline capacity is not explicitly labeled AC or DC, so it should not be combined with differently defined ratings to produce a world ranking.
4. Noor Abu Dhabi - UAE
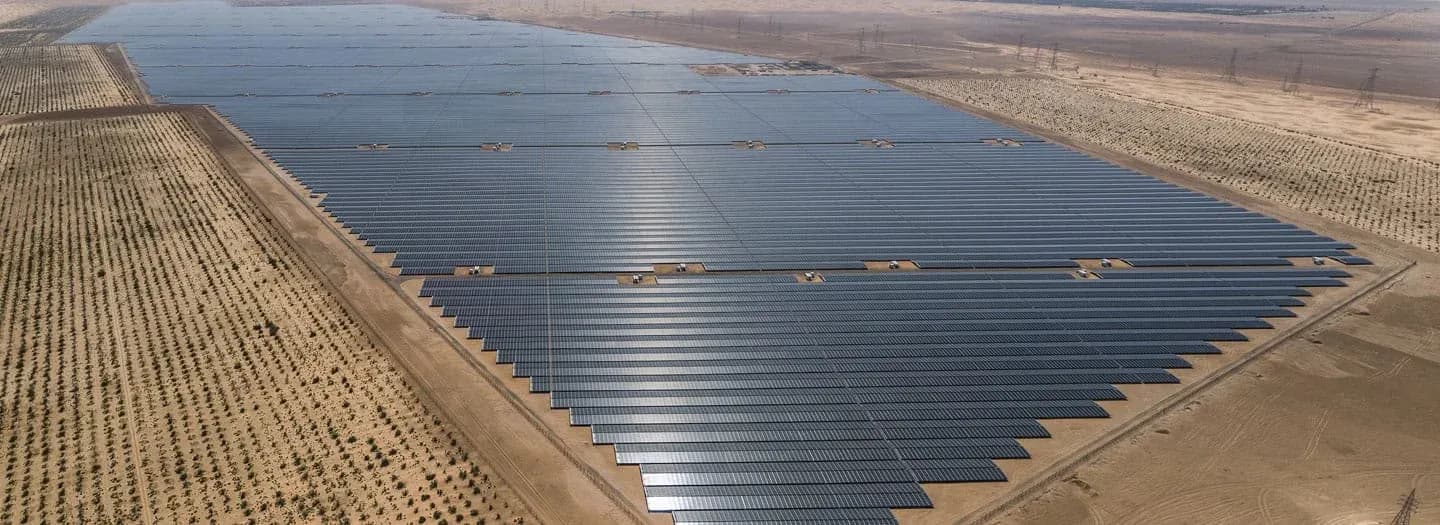
Noor Abu Dhabi is a solar photovoltaic plant in the United Arab Emirates. Its operator’s September 2021 Green Bond Framework records 1,177 MW DC, 3.2 million panels and commercial operation from 30 April 2019. DC denotes the photovoltaic array’s rated capacity, not AC delivery to the grid. These are dated project facts, not a current global ranking or a measured annual-generation figure. Source: Noor Abu Dhabi: Green Bond Framework
5. Kamuthi Solar Power Project - India
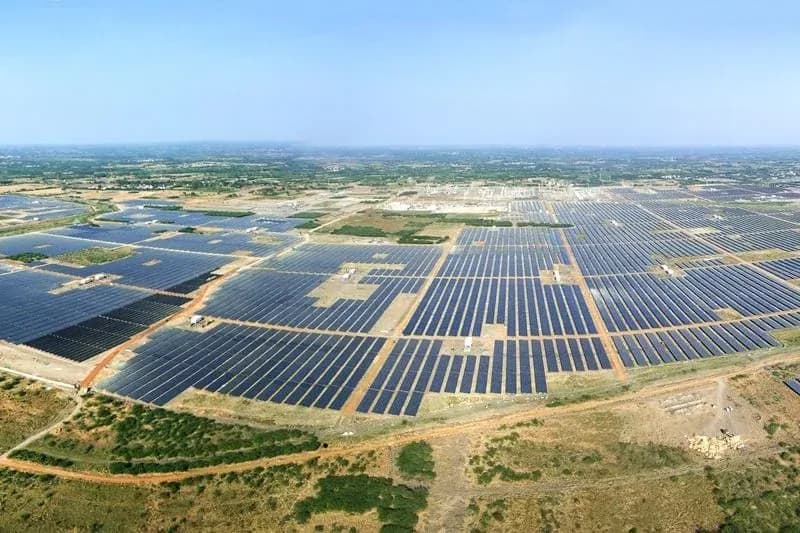
Kamuthi Solar Power Project is located in Tamil Nadu, India. Adani’s announcement of 21 September 2016 records 648 MW connected to the Kamuthi substation and approximately 2.5 million solar modules. The cited announcement does not label its MW figure as AC or DC. These are dated project facts; the announcement’s historical size claim does not establish Kamuthi’s current global position.
6. Benban Solar Park - Egypt
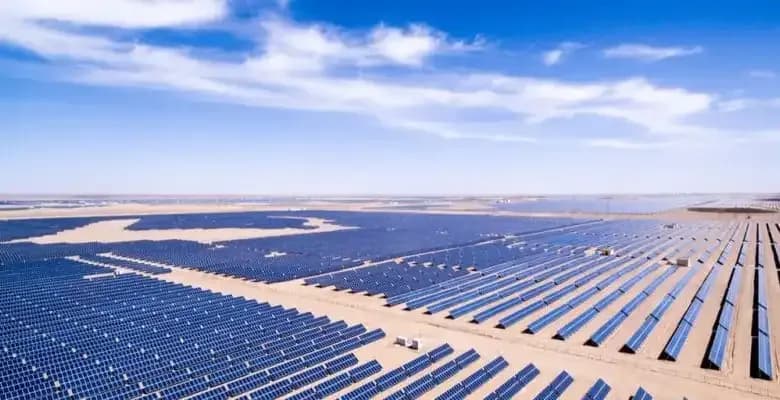
Benban Solar Park near Aswan, Egypt, combines multiple photovoltaic projects. The EBRD account of its first financed plant entering operation, published in 2019, describes 1,465 MW of contracted capacity across the park and 750 MW expected from the 16 EBRD-financed plants once completed. Contracted capacity and a financed portfolio are different boundaries; neither figure should be relabeled as a verified current operational total.
7. Kurnool Ultra Mega Solar Park - India
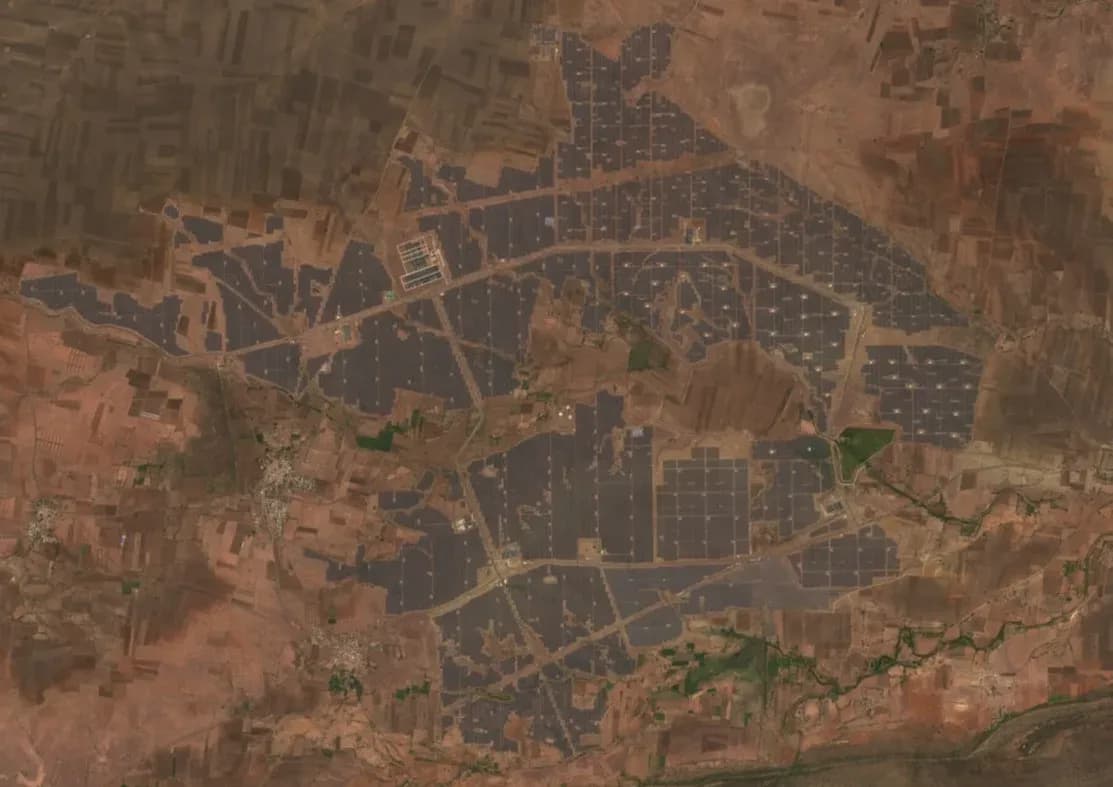
Kurnool Ultra Mega Solar Park is located in Andhra Pradesh, India. The Indian Ministry of New and Renewable Energy’s 2017 year-end review records 1,000 MW already commissioned and operational at Kurnool. The cited passage does not specify an AC/DC basis. Treat this as a dated park-capacity statement, not a current world ranking or an estimate of annual electricity delivered.
8. Longyangxia Dam Solar Park - China
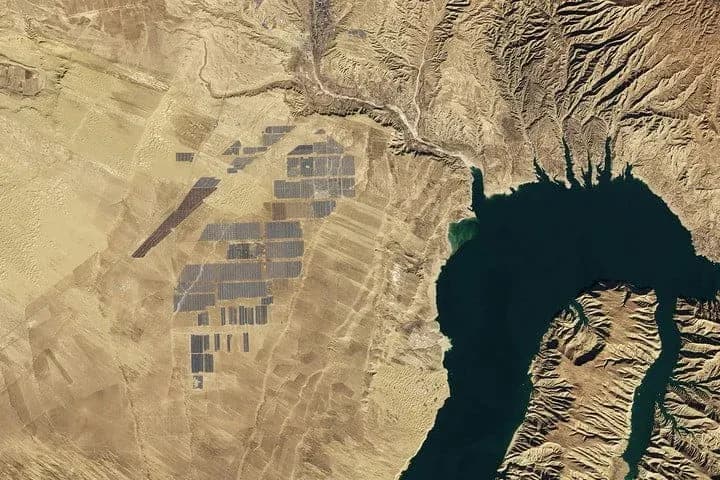
Longyangxia in China is associated with coordinated solar and hydropower development. NASA’s 2017 account described an 850 MW solar park. Keep the PV capacity separate from the dam’s hydropower capacity: solar modules do not themselves generate hydroelectric energy.
9. Pavagada Solar Park - India
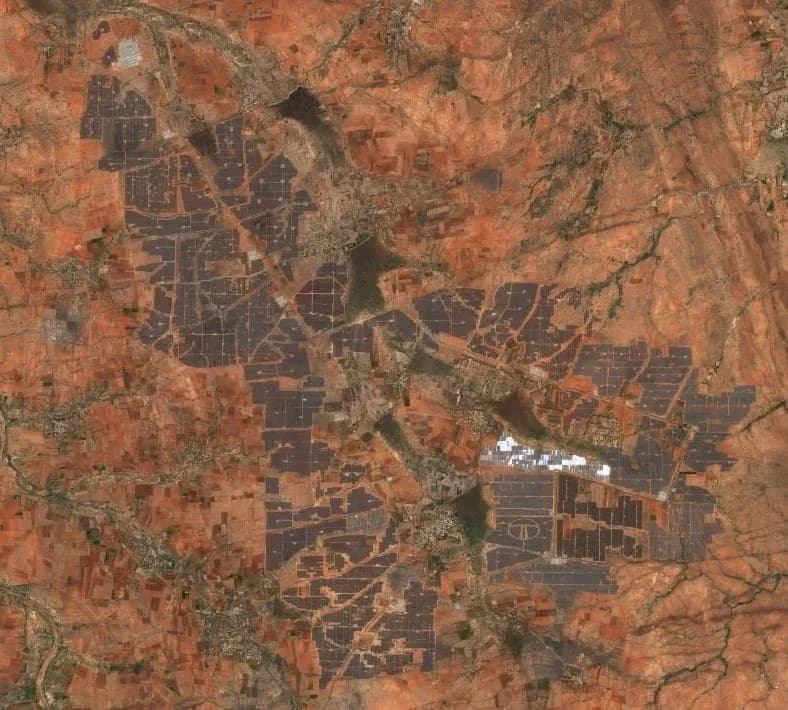
Pavagada Solar Park in Karnataka, India, illustrates a development with shared infrastructure serving multiple project developers. A Government of India announcement dated 7 February 2023 describes a 2,050 MW park that became operational in December 2019. It identifies Karnataka Solar Power Development Corporation as the developer of the shared balance-of-system infrastructure. The capacity is reproduced as reported; the announcement does not state an AC/DC basis.
10. Datong Solar Power Top Runner Base - China
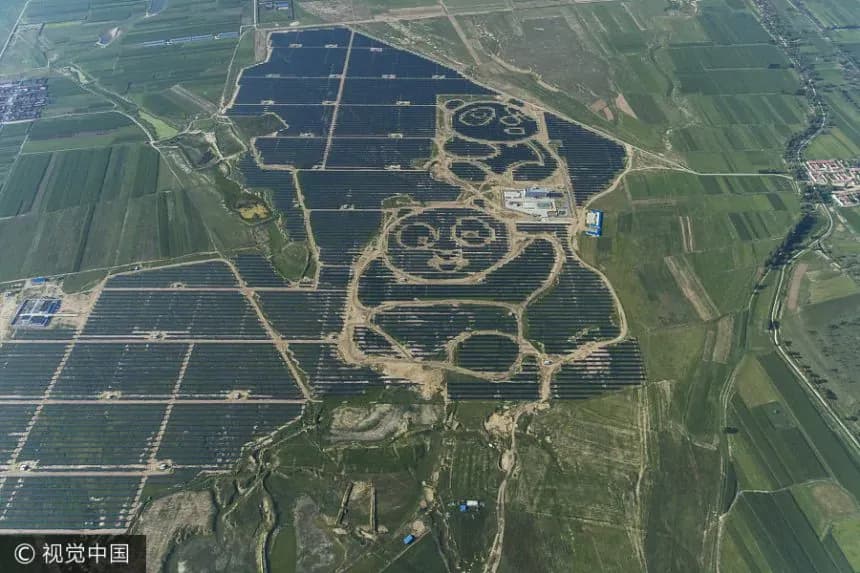
Datong Solar Power Top Runner Base in Shanxi, China, is an example of phased photovoltaic demonstration development. The Datong government’s 2016 work report, published on 8 June 2016, records construction starting across a national photovoltaic demonstration project with a planned capacity of one million kW, equivalent to 1,000 MW. That passage describes construction, not confirmation that the full capacity was already operational. No combined total is calculated for this directory because its sources use different dates, project boundaries and capacity definitions.
Large arrays need consistent asset identification, inspection evidence and maintenance follow-up. MapperX can support inspection-data analysis for that workflow; inclusion of a plant in this article does not imply it is a MapperX customer. Read about infrared thermography for the inspection method.
How to compare large solar plants fairly
- Choose a snapshot date and count only the operational capacity appropriate to the comparison. Keep planned or under-construction phases separate.
- State the boundary: one generating facility, several projects sharing a solar park, or a wider renewable-energy complex.
- Label capacity as MWdc, MWac or grid export capacity when the source supplies that distinction. Do not silently substitute one for another.
- Use measured annual generation for a specified year when comparing energy, and state whether storage, on-site consumption or other generation is included.
A larger nameplate rating does not guarantee more electricity in every year. Solar resource, temperature, availability, curtailment and operating strategy all influence energy delivered. Even two equally rated sites can have different annual yields. The solar production calculation guide explains the difference between capacity and energy.
What scale changes for operations teams
At a large park, locating the exact module and responsible operator matters as much as detecting an anomaly. Keep the electrical layout, asset identifiers and inspection records aligned. Grouping findings by string, inverter or project can help distinguish a localized defect from a shared operational issue, while the safety response and field verification remain site-specific.
Frequently asked questions
Is this a live ranking of the world’s ten largest solar plants?
No. It is an unranked directory of ten historically notable projects. A live ranking requires a dated dataset with consistent plant boundaries, commissioning status and AC/DC capacity definitions.
Why do different sources give different capacities for the same solar park?
They may describe different phases, dates, approved versus commissioned capacity, or DC versus AC ratings. Check the original source’s definition before deciding which figure applies.
Does a larger solar park necessarily deliver more annual electricity?
No. Capacity is only one input. Irradiation, losses, downtime and curtailment influence annual generation, so compare measured energy over the same period and boundary.