
How AI-Assisted Thermography Detects Solar Panel Faults
How AI-assisted thermography uses thermal and RGB drone imagery to flag suspected solar panel faults for human review and field validation.
Quick answer
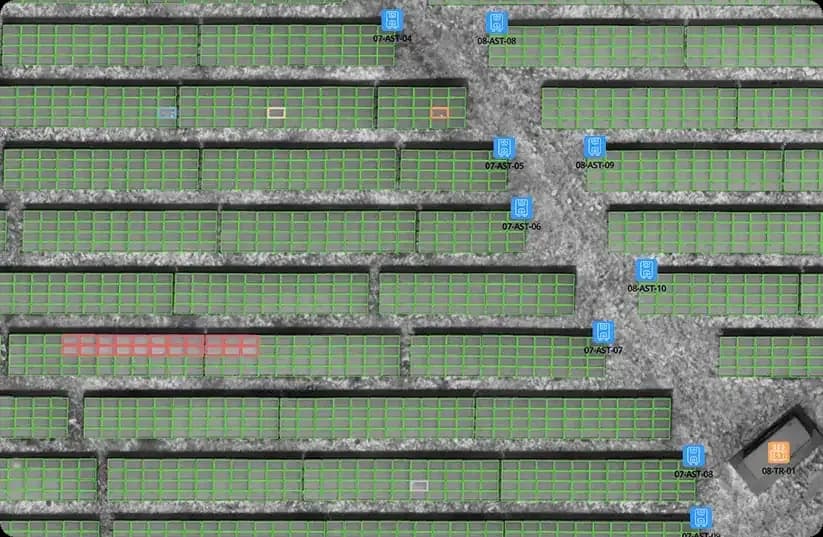
AI-assisted thermography detects solar panel faults by analyzing thermal and RGB drone imagery, segmenting every module and comparing its temperature pattern against known anomaly signatures. Detected patterns are grouped, mapped to a module position and ranked by severity, so field teams review a short prioritized list with its evidence instead of thousands of raw frames.
TL;DR
- A faulty photovoltaic cell can dissipate energy as heat, so some electrical defects invisible in RGB imagery may show up as thermal patterns, depending on capture conditions.
- The analysis segments every module, compares its temperature pattern against known anomaly signatures and ranks the results; it proposes a class, it does not confirm a root cause.
- Automated-analysis timing requires a dated, equal-scope test disclosing dataset size and quality, hardware/software versions and acquisition conditions, with flight, upload, processing, human validation and reporting timed separately.
- Severity follows pattern type, extent and persistence rather than a single temperature reading, and IEC 62446-3 abnormality classes turn findings into a work queue.
- Every finding keeps its module position and its source imagery, which is what makes the output usable for standard-aligned reporting and for comparison between campaigns.
What Is AI-Assisted Solar Thermography?
AI-assisted solar thermography is the automated analysis of thermal and RGB drone imagery to locate temperature patterns associated with photovoltaic anomalies. Detection models group those patterns, map them to individual modules and propose an anomaly class for technical review. The output is a prioritized list of suspected faults with the evidence attached to each one, not a diagnosis.
The physics underneath is straightforward. A photovoltaic cell that cannot convert the energy reaching it dissipates part of that energy as heat, so a module with a suspected hotspot, a conducting bypass diode or an interrupted string runs at a different temperature than its healthy neighbors. A thermal camera on a drone records that difference across the whole plant, and the difference is invisible in ordinary RGB imagery. The underlying failure modes are documented in the IEA PVPS Task 13 review of photovoltaic module failures.
Compared with an analyst working frame by frame, the difference is coverage and consistency: every module in the dataset is evaluated against the same criteria, and every finding keeps a link back to the image it came from. This article is about that detection step. What the resulting document has to contain is covered in understanding IEC 62446-3 inspection reports, and the end-to-end workflow is described on the solar panel inspection software page.
How Does the Analysis Turn Imagery Into Findings?
The pipeline runs in five stages, and each one is a place where quality can be lost.
Ingestion. The thermal and RGB imagery from a flight is uploaded and organized into a single dataset tied to one plant, one campaign and one capture window. Positioning data travels with each frame.
Alignment and segmentation. The RGB imagery is used to build a georeferenced orthophoto of the site, and every photovoltaic module is segmented on it so that a stable module position exists to attach findings to.
Comparison. Each module's temperature pattern is compared against its neighbors and against known anomaly signatures. The comparison is relative rather than absolute, because a plant does not have one correct module temperature.
Grouping and classification. Patterns that belong to the same physical phenomenon are grouped, and each group is given a proposed anomaly class with the thermal frame and the matching RGB view attached.
Ranking and review. Findings are ranked so that a reviewer starts with the ones that matter, then accepts, reclassifies or rejects each of them.
Automated processing time depends on dataset size and quality, computing resources and workload; the end-to-end turnaround also depends on human-review capacity. A timing comparison requires a dated test identifying dataset size and quality, hardware and software versions, acquisition conditions and equal scope. Flight, upload, automated processing, human validation and reporting, including report sign-off, must be timed separately: automated analysis alone is not an end-to-end inspection time. Full test conditions must be disclosed, and results are not contractual guarantees. Timings on your own data are the only ones worth planning against.
How Does the Model Decide That a Pattern Is an Anomaly?
Four signals carry most of the decision, and none of them is a single temperature reading.
The first is the relative difference between a module or cell area and a comparable reference nearby, which is what removes the influence of the day's ambient conditions. The second is the shape and extent of the warm area: a compact spot inside one cell, a sharply bounded third of a module and a whole uniformly warm row are different physical stories, not different intensities of the same one. The third is the position of the pattern within the module, which is what separates junction box heating from cell heating. The fourth is persistence across the frames that cover the same module, which is what a reflection usually fails.
Two error modes matter, and both are real. False positives come from reflections, local soiling, transient shading and non-perpendicular capture angles. False negatives come from faults that are not thermally expressed at the moment of capture, from uniform degradation that leaves no local contrast, from coverage gaps at plant edges and from a ground sample distance too coarse for the pattern being looked for.
This is why human review is part of the method rather than an optional extra. Each finding is presented with its thermal and its RGB evidence so a reviewer can accept it, reclassify it or reject it, and a rejected finding stays in the record rather than disappearing. MapperX does not publish per-class precision and recall figures for its detection models, so accuracy should be assessed on your own plant during a pilot campaign rather than taken from any vendor's marketing material, including this article.
Which Thermal Patterns Are Detected and Classified?
The pattern families below are the ones a module-level thermal analysis can separate. A thermal pattern is a symptom rather than a confirmed root cause: classification narrows the search, and a field check settles it.
Hotspots
Definition: A localized area of elevated temperature relative to adjacent cells or modules.
Thermal pattern: A compact warm spot inside a single module, clearly warmer than the surrounding cell area.
Possible causes: Cell damage, persistent shading, contamination, interconnection issues or electrical mismatch.
Field verification: Close visual check of the module surface and, where needed, electrical measurement of the affected string.
False-positive risk: Temporary reflections or local soiling can mimic a hotspot; RGB comparison reduces this risk.
Cell-level patterns
Definition: A temperature difference limited to one or a few cells within a module.
Thermal pattern: One or several distinct warm cells while the rest of the module stays uniform.
Possible causes: Micro-cracks, cell degradation or manufacturing defects.
Field verification: Module-level inspection and, if the pattern persists across campaigns, electroluminescence or electrical testing.
False-positive risk: Small soiling spots can resemble single-cell heating on coarse imagery.
Bypass diode patterns
Definition: A characteristic pattern where roughly one third or two thirds of a module runs warmer than the rest.
Thermal pattern: A sharply bounded warm substring section covering a repeating fraction of the module.
Possible causes: A failed or permanently conducting bypass diode, or a shaded substring forcing the diode to conduct.
Field verification: Junction box and diode check by qualified personnel.
False-positive risk: Sustained partial shading can produce a similar substring pattern during the flight window.
String-level anomalies
Definition: A temperature difference affecting an entire string of modules rather than a single module.
Thermal pattern: A whole row or string appears uniformly warmer or cooler than neighboring strings.
Possible causes: Open circuits, connector failures, inverter input issues or string-level configuration faults.
Field verification: Electrical measurement at the combiner or inverter input; the map narrows which string to test.
False-positive risk: Strings under different irradiance or tilt conditions can show benign temperature offsets.
Junction box heating
Definition: Elevated temperature centered on the module junction box area.
Thermal pattern: A warm zone at the junction box position, often near the module edge.
Possible causes: Loose connections, corrosion or diode-related heating inside the box.
Field verification: Physical inspection of the junction box and its connectors.
False-positive risk: Sun-heated dark box covers can read warmer than the laminate without any electrical fault.
Shading and soiling effects
Definition: Temperature patterns caused by external obstructions or surface contamination rather than component failure.
Thermal pattern: Irregular warm or cool patches that follow vegetation lines, dust bands or bird droppings.
Possible causes: Vegetation growth, nearby structures, dust accumulation or localized droppings.
Field verification: Site cleaning or vegetation management, then a follow-up campaign to confirm the pattern is gone.
False-positive risk: These effects are themselves a common source of false anomaly reports when RGB imagery is not reviewed.
Connection-related heating
Definition: Elevated temperature at cabling and connector points between modules.
Thermal pattern: Warm points along module edges or cable routes, outside the cell area.
Possible causes: Loose, corroded or poorly crimped connectors.
Field verification: Torque and continuity checks on the affected connectors.
False-positive risk: Reflections from cable insulation can occasionally read as warm points.
From Pattern to Priority: How Is Severity Assigned?
Detecting a pattern is only half the job. The practical question for an operations team is which findings justify immediate action, which belong in planned maintenance and which are only worth monitoring.
IEC 62446-3 frames this with abnormality classes used in professional reporting. The authoritative wording sits in the purchased document, and the practical effect is that a finding arrives with a class and a recommended action rather than as an undifferentiated warm spot. A bypass diode failure that takes a third of a module out of production sits in a different class than a mild soiling pattern, even when both are obvious in the thermal layer.
Temperature difference on its own is not a severity score. The same physical fault reads differently depending on irradiance, wind and ambient temperature at the moment of capture, which is why classification weighs pattern type, extent and persistence rather than one absolute number. Comparing findings across campaigns is meaningful only when the campaigns were flown under broadly comparable conditions; two flights at different irradiance levels are not directly comparable, however neatly the numbers line up.
Some classes carry a safety dimension in addition to a yield one, notably hotspots and junction box heating, and the IEA PVPS Task 13 review of module failures documents the failure modes behind them. What a given finding is worth in money depends on the tariff, the plant size and the repair cost at that site, so this article publishes no generic payback figure.
In MapperX, ranked findings become a work queue: each anomaly carries its class, its position on the plant layout and its source imagery, so maintenance planning starts from the most productive interventions rather than from a flat list.
What Data Does the Analysis Need?
The quality of an AI-assisted analysis is largely decided in the air.
Positioning
RTK Fix can provide centimeter-level image positioning, helping the analysis attach thermal frames to modules on the plant map. Correct module attribution still depends on acquisition conditions, image alignment and validation. MapperX recommends RTK Fix for module-level workflows. It is not a requirement written into IEC 62446-3, and a survey flown without it can still describe a plant at block level, but findings become harder to attribute to one module and field teams lose time locating the real fault.
Ground sampling distance
Ground sample distance, or GSD, is the ground distance represented by a single image pixel, set mainly by flight altitude. MapperX documents two analysis levels, 3 cm and 5 cm per pixel, in its knowledge base. These are product configuration levels rather than thresholds set by the standard. Flying higher than the ordered level hides cell-level patterns, and flying lower slows the mission without adding diagnostic value at that level.
Temperature-embedded thermal data
The analysis needs thermal imagery in which every pixel carries a measurable temperature value, such as the R-JPEG files produced by common thermal payloads. Screen-color thermal exports without embedded temperature data cannot be measured and are not sufficient for a standard-aligned analysis.
Irradiance and plant load
Load-dependent faults only appear while the plant is producing. IEC 62446-3 sets minimum irradiance conditions for a valid survey; 600 W/m² is the figure commonly cited from it, and the exact wording is in the purchased document. Stability matters as much as the level, because a passing cloud front changes module temperatures faster than a drone can cover a block.
Camera angle
Thermal cameras read apparent temperature, and module glass reflects strongly at shallow angles. Keeping the camera close to perpendicular to the module surface, while avoiding the drone's own reflection and direct sun glint, prevents a large share of avoidable false positives.
Coverage and overlap
Sufficient front and side overlap, plus a flight margin beyond the plant boundary, ensures every module appears in enough frames to be measured reliably. Missing coverage means the affected strings simply cannot be analyzed, and an unanalyzed string is not a healthy one.
Which Conditions Cause False Positives, and When Is a Re-Flight the Right Answer?
Typical sources of false positives are:
- Sun reflections from module glass at certain flight angles.
- Local soiling, dust bands or droppings that heat differently than clean laminate.
- Transient shading from clouds, structures or vegetation during the flight.
- Ambient temperature drift across large sites captured over a long flight window.
- Non-perpendicular camera angles that distort apparent module temperatures.
Pairing thermal and RGB evidence on every finding is what lets a reviewer separate these from patterns that need electrical follow-up. It reduces the risk; it does not remove the review.
Some datasets should not be analyzed at all. The usual reasons for a re-flight are positioning recorded as Float rather than Fix, incomplete coverage of strings or plant sections, fast irradiance changes during capture, thermal files that carry no measurable temperature data, and a ground sample distance far outside the ordered analysis level. When one of these occurs, fixing the flight parameters and re-flying the affected area is cheaper than defending a conclusion the data cannot carry.
What AI-Assisted Detection Does Not Do
It does not confirm a root cause. A bypass-diode pattern narrows the diagnosis to a specific substring, but whether the diode failed or a shading condition triggered it is settled by a field check.
It does not measure electrical parameters. Temperature behavior is an indirect signal, and I-V curve tracing, insulation testing and connector checks measure what thermography can only suggest.
It does not replace qualified personnel, and it does not make an inspection compliant with anything. Compliance follows from the obligation that applies to the site, and accredited inspection activities are performed within the accredited scope of the responsible inspection body, not by analysis software.
Where This Sits Next to Other Inspection Methods
I-V curve tracing measures the electrical signature of a string and confirms underperformance precisely, at the cost of physical access, disconnection work and time on site. Used after a thermographic screening, it validates exactly the strings the thermal map narrowed down.
Electroluminescence imaging reveals micro-cracks and cell damage invisible to both RGB and thermal cameras, typically at night or in a controlled setting. It is the natural follow-up when cell-level thermal patterns persist across campaigns.
Monitoring data detects that production dropped, often before anyone flies, but cannot localize the loss to a module or explain its physical cause.
None of these replaces the others. Screening first to localize, then measuring to confirm, keeps both inspection cost and plant downtime low.
Where the Standard and the Report Fit
IEC 62446-3 is the international technical specification for outdoor infrared thermography of photovoltaic modules and plants, published by the IEC in 2017. It describes how such a survey should be performed and documented. It is not legislation, it does not oblige anyone to inspect a plant, and it does not prescribe an inspection interval; obligations to inspect come from national regulation, insurance conditions or contracts, and they differ by market.
MapperX produces standard-aligned inspection data and documentation from the evidence chain described above. Where a national regime reserves an inspection to an accredited body, that body remains the party performing and issuing the regulated inspection. What the document itself has to contain, and where an obligation to inspect actually comes from, is the subject of understanding IEC 62446-3 inspection reports.
From Findings to a Plant Record
The value of an inspection is realized in the weeks after the flight, when findings turn into completed work orders. Prioritized findings are assigned, field teams verify and repair, and the resolution status is recorded against the same module identity the anomaly was detected on.
Because every finding is tied to a fixed position in the plant layout, follow-up campaigns can answer questions a single inspection cannot: whether a repaired module stayed healthy, whether a mild pattern is progressing, and whether a plant section is developing a systematic issue. How that record is built and kept usable is the subject of building a digital twin of your solar plant, and credit-based MapperX plans price the analysis per campaign so screening frequency can follow the plant's risk profile. The MapperX platform page documents the current supported drone models and the flight parameters each analysis level expects.
Key facts
- Detection level
- Module level, mapped to the plant layout
- Pattern families
- Hotspot, cell level, bypass diode, string level, junction box, shading or soiling, connection heating[2]
- Analysis speed
- In MapperX software tests, automated analysis of a 10 MW plant took approximately 15 minutes. This covers software analysis only; flight, upload, human review and report sign-off are separate stages.
- Human review
- Every finding is proposed with thermal and RGB evidence, then accepted, reclassified or rejected by a reviewer
- Reporting structure
- Report content aligned with IEC 62446-3; accreditation stays with the responsible inspection body[1]
- Imagery required
- Temperature-embedded thermal (for example R-JPEG) plus RGB from the same flight; MapperX publishes the current supported drone models[3]
- Analysis levels
- 3 cm and 5 cm GSD workflows (MapperX product documentation, not thresholds set by the standard)[3]
- Positioning
- RTK Fix recommended for module-level attribution; not a requirement of IEC 62446-3[1]
Frame-by-frame manual review vs. AI-assisted analysis
| Manual review | AI-assisted analysis | |
|---|---|---|
| Coverage | Sampling or partial review under time pressure | Every module in the dataset evaluated against the same criteria |
| Consistency | Varies between reviewers and between sessions | Same criteria applied across the dataset and between campaigns |
| False-positive handling | Depends on the reviewer noticing the RGB context | Thermal and RGB evidence paired on every finding for review |
| Traceability | Manual cross-referencing between images and layout | Each finding linked to a module position and its source frame |
| What still needs a person | The entire review | Accepting, reclassifying or rejecting each finding, plus field verification |
How an AI-assisted thermographic inspection works
- 01
Fly the plant with a thermal drone
A drone carrying a thermal payload that records temperature-embedded imagery alongside RGB covers the whole site while the plant is producing under stable irradiance.
- 02
Upload the flight data
The imagery is uploaded to MapperX and organized into a single dataset tied to one plant, one campaign and one capture window, with positioning data attached to each frame.
- 03
Analyze every module
Modules are segmented and compared against known anomaly signatures. Detected patterns are grouped, given a proposed class and ranked, with the thermal and RGB evidence attached to each one.
- 04
Review the findings, then report
A reviewer accepts, reclassifies or rejects each finding on the plant map, and the accepted set is exported into a report structured to the content requirements of IEC 62446-3.
Technical details
Capture parameters the analysis depends on
| Irradiance | At least 600 W/m² as commonly cited from IEC 62446-3, and stable during the flight |
|---|---|
| Plant state | Operating under load, because load-dependent faults are invisible on a disconnected string |
| Time of day | Late morning to early afternoon, clear sky |
| Positioning | RTK Fix recorded for every image (MapperX recommendation) |
| GSD | 3 cm or 5 cm per pixel, matching the ordered MapperX analysis level |
| Thermal data | Temperature-embedded files with per-pixel temperatures, for example R-JPEG |
| Camera angle | Close to perpendicular, avoiding sun glint and drone reflection |
| Coverage | Front and side overlap with a margin beyond the plant boundary |
Thermal pattern quick reference
| Hotspot | Close visual check; electrical measurement if persistent |
|---|---|
| Bypass diode pattern | Junction box and diode check by qualified personnel |
| Cell-level pattern | Monitor across campaigns; electroluminescence imaging if persistent |
| String-level anomaly | Electrical measurement at combiner or inverter input |
| Junction box heating | Physical inspection of box and connectors |
| Shading or soiling | Cleaning or vegetation management, then a follow-up campaign |
| Connection heating | Torque and continuity checks on affected connectors |
Tips and common mistakes

- Tip
Fly at an irradiance of at least 600 W/m² and in stable conditions, so load-dependent anomalies appear clearly in the thermal data.
- Tip
Fly at the ground sample distance the ordered analysis level expects, 3 cm or 5 cm per pixel, so patterns stay classifiable at module level.
- Avoid
Flying in the early morning or under heavy cloud hides load-dependent anomalies and produces misleading results.
- Avoid
Judging defects from RGB imagery alone misses electrical faults that only show up as thermal patterns.
- Tip
Keep wind conditions in mind: strong wind cools module surfaces and can compress the temperature differences the analysis depends on.
- Tip
Fly follow-up campaigns under conditions similar to the baseline flight, because findings from campaigns flown under different irradiance are not directly comparable.
- Avoid
Capturing modules at a shallow angle invites glass reflections that read as false warm spots; keep the camera close to perpendicular.
- Avoid
Treating a proposed classification as a confirmed root cause; a thermal pattern narrows the diagnosis, and a field check settles it.
Frequently asked questions
There is no single threshold. Detection compares a module against comparable neighbors rather than against an absolute value, because irradiance, wind and ambient temperature move every reading on the site together. A compact hotspot, a sharply bounded substring and a uniformly warm row are different patterns, and the pattern carries more diagnostic weight than the number of degrees.
MapperX does not publish per-class precision and recall figures, so no accuracy percentage should be quoted from this article. What can be stated is the method: every finding is presented with its thermal and RGB evidence and is accepted, reclassified or rejected by a reviewer. Assess accuracy on your own plant during a pilot campaign, on data you captured yourself.
No. Aerial thermography localizes and classifies suspected anomalies across the whole plant quickly, and electrical tests then confirm the diagnosis on the affected strings. Thermography observes temperature behavior; it does not measure electrical parameters, and the two are complementary rather than interchangeable.
No. Software can produce data and documentation structured to the content requirements of IEC 62446-3, which is what MapperX does. Whether an inspection satisfies an obligation depends on the obligation itself, and accredited inspection activities are performed within the accredited scope of the responsible inspection body rather than by analysis software.
Any drone carrying a thermal payload that records temperature-embedded imagery, such as R-JPEG, alongside RGB in the same flight, with positioning good enough for module-level attribution. Model support changes over time, so check the current supported list and the per-model flight parameters in the MapperX knowledge base rather than relying on a list in an article.
Detected patterns are grouped, ranked and presented with the matching RGB view, which is what lets a reviewer separate reflections, soiling and transient shading from patterns that need electrical follow-up. This reduces review effort rather than removing review: the reviewer, not the model, decides which findings enter the report.
It is a MapperX recommendation for module-level workflows, not a requirement written into IEC 62446-3. RTK Fix can provide centimeter-level image positioning to support module attribution, but correct attribution also depends on acquisition conditions, image alignment and validation. With Float or standard GPS data a survey can still describe a plant at block level, but findings may drift onto neighboring modules and field verification can take longer.
It depends on the analysis level you ordered. MapperX documents 3 cm and 5 cm per pixel workflows in its knowledge base; these are product configuration levels rather than thresholds set by the standard. Flying above the ordered level hides cell-level detail, and flying below it costs mission time without adding diagnostic value.
Yes. RGB imagery builds the orthophoto and the module map that thermal findings are placed on, and it provides the visual context a reviewer needs to separate soiling, shading and reflections from patterns that indicate an electrical fault.
In MapperX software tests, automated analysis of a 10 MW plant took approximately 15 minutes. This covers software analysis only; flight, upload, human review and report sign-off are separate stages.
No. The inspection requires the plant to be operating under load, so imagery is captured while the site keeps producing. No shutdown, disconnection or physical contact with the modules is needed during the flight itself, although field verification of individual findings may require access afterwards.
Glossary
An image in which each pixel stores a measurable temperature value rather than only a color. This is what makes quantitative fault analysis possible.
A temperature-embedded JPEG format produced by common thermal payloads. It carries per-pixel temperature data alongside the visual image.
The ground distance represented by one image pixel, set mainly by flight altitude. A smaller GSD provides finer spatial detail, which can support module-level classification; reliability also depends on image quality, capture conditions and validation.
A fixed RTK positioning state that can provide centimeter-level image positioning. It supports attribution of findings to individual modules, but correct attribution also depends on acquisition conditions, image alignment and validation.
A localized area of elevated temperature inside a module. Typical causes include cell damage, contamination, persistent shading and electrical mismatch.
A protective component that routes current around a shaded or damaged substring. Its failure or activation can produce a characteristic one-third or two-thirds thermal pattern, depending on module design. The pattern alone does not confirm diode failure.
A series-connected group of modules feeding one input of a combiner or inverter. String-level anomalies affect the whole group at once rather than a single module.
A georeferenced, distortion-corrected aerial image of the plant. It is the base map on which thermal findings are located.
The temperature difference between an anomaly and its reference area. It is interpreted together with pattern shape and capture conditions, never in isolation.
The severity category assigned to a detected thermal anomaly in a standard-aligned report. It determines whether a finding needs prompt intervention, planned maintenance or monitoring only.
A real fault that the analysis did not surface, for example because it was not thermally expressed at capture time or because coverage or resolution was insufficient. It is the error mode a pilot campaign should test for.
Sources and standards
- IEC 62446-3:2017, Photovoltaic (PV) systems: Requirements for testing, documentation and maintenance, Part 3: Outdoor infrared thermography
- IEA PVPS Task 13: Review of Failures of Photovoltaic Modules
- MapperX knowledge base (first-party product documentation): supported drones, flight parameters and analysis levels
Conclusion
AI-assisted solar thermography analyzes thermal and RGB drone imagery to detect temperature patterns associated with photovoltaic anomalies. It locates, groups and proposes a class for suspected issues at module or string level: hotspots, cell-level patterns, bypass-diode patterns, string outages, junction box heating, connection heating, and shading or soiling effects. Detection compares each module against comparable neighbors rather than against an absolute temperature, and weighs pattern shape, extent, position and persistence. Findings are ranked and presented with their thermal and RGB evidence, and a reviewer accepts, reclassifies or rejects each one; the analysis proposes a class and does not confirm an electrical root cause, which requires field verification or electrical testing. In MapperX software tests, automated analysis of a 10 MW plant took approximately 15 minutes. This covers software analysis only; flight, upload, human review and report sign-off are separate stages. Severity classification follows the abnormality classes used in IEC 62446-3 reporting; that specification is not legislation, creates no inspection obligation and sets no interval, and accredited inspection activities remain within the accredited scope of the responsible inspection body.