
How to Detect a Faulty Solar Panel
How to detect a faulty solar panel: failures may occur over time or due to external factors. Start with monitoring data, visual signs and aerial thermography.
How Faulty Panels Show Up in Practice
A faulty PV module does not always appear as a completely failed panel. Some problems first appear as a production difference, an inverter or monitoring alarm, an abnormal temperature pattern, visible physical damage, or an electrical measurement that differs from comparable modules or strings. The most reliable inspection process combines these signals instead of expecting one test to identify every failure.
The first task is to define what appears abnormal. A module may produce less current because of shading or contamination rather than an internal defect, while a string may show unusual voltage because of its configuration or temperature. The observation should be separated from the diagnosis until enough evidence has been collected.
Fault finding is usually faster when it moves from broad evidence toward increasingly specific verification. Plant monitoring can identify an affected electrical area, visual and thermal inspection can narrow the location, and electrical testing can then examine the suspected circuit or component directly.
This sequence also reduces unnecessary replacement. A module should not be classified as faulty simply because one image, current value, or alarm looks unusual without considering the conditions under which that evidence was collected.
Start with Production and Monitoring Data
Plant monitoring is often the first place to look when a module or string problem is suspected. Inverter inputs, string monitoring channels, alarms, and production trends can show that one part of the array is behaving differently from comparable equipment. The useful comparison depends on similar orientation, irradiance, module configuration, and operating conditions.
A production deviation does not identify the cause by itself. Shading, clipping, curtailment, soiling, communication errors, sensor problems, inverter behavior, and temporary environmental conditions can all influence recorded output. The monitoring signal should therefore be used to define where inspection is needed rather than to name the failed component.
Historical information can be particularly useful. If the same string repeatedly differs from nearby strings under comparable conditions, the pattern may justify targeted inspection. A one-time deviation during rapidly changing cloud cover may be less informative.
Monitoring also helps determine whether the problem is persistent or intermittent. An intermittent connector or electrical condition may disappear before a technician reaches the site, while the time-series data can still show when and where abnormal behavior occurred.
Once the affected block, inverter input, or string has been identified, the field team can reduce the area that needs detailed inspection.
Visual Signs on the Module
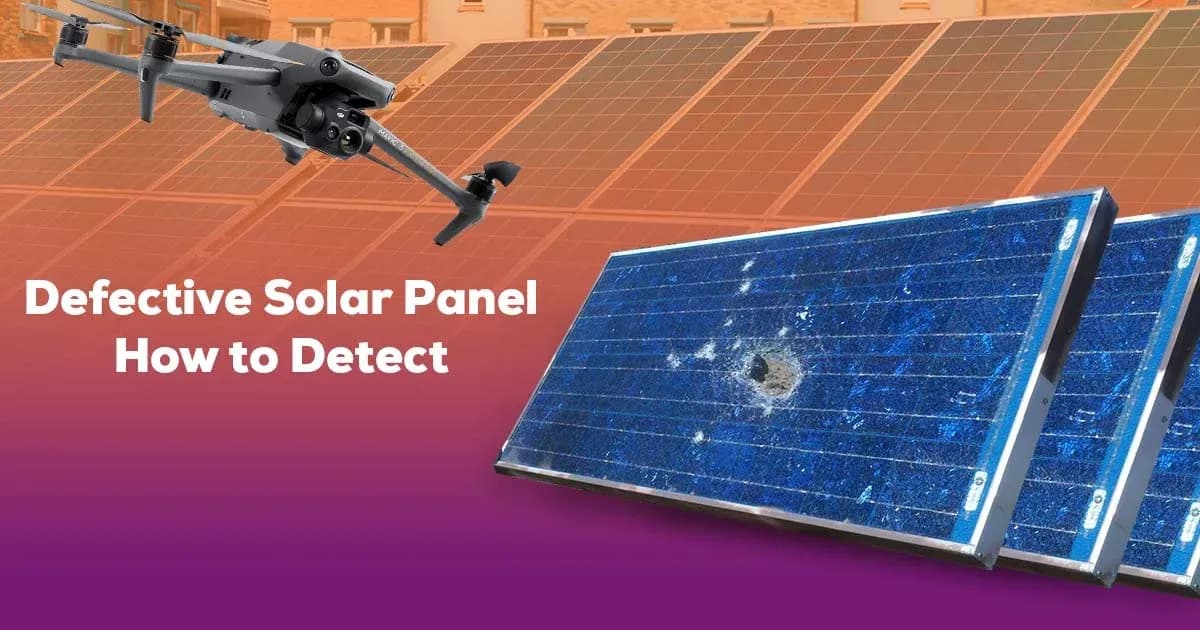
Visual inspection can reveal conditions that plant-level electrical data cannot identify directly. Broken glass, damaged backsheets, displaced frames, damaged junction boxes, loose components, cable problems, discoloration, severe contamination, and obvious physical impact can all justify closer examination.
Soiling and shading should be considered before a module is classified as electrically defective. Dust, bird contamination, leaves, vegetation, nearby structures, or temporary objects can reduce irradiance reaching part of the module. Their effect depends on coverage, module design, bypass behavior, and the operating conditions at the time.
Color changes can also require interpretation. Discoloration may point to material aging, localized heating, contamination, or another condition, but appearance alone does not establish the electrical consequence. The same applies to marks on glass or frames that may be cosmetic rather than functionally significant.
The junction box and accessible cable route can provide additional evidence. Damage, poor sealing, displaced cables, connector problems, or signs of moisture deserve investigation because they may affect the module or string electrically.
Visible inspection works best when each finding is tied to a module or row identifier. A photograph without a reliable location can be difficult to turn into a maintenance action.
What Aerial Thermography Adds
Aerial thermography allows an O&M team to screen many operating modules for temperature patterns that differ from surrounding equipment. Localized hot regions, cool regions, module-level differences, and unusual string patterns can direct attention toward specific locations that require verification.
A hot cell or cell group may indicate abnormal electrical or physical behavior, while a broader module pattern may be associated with bypass-diode operation, shading, circuit condition, or another factor. A cooler-than-expected module or string can also be relevant if it reflects a different operating state. The image shows thermal behavior, not the final diagnosis.
IEC 62446-3 addresses outdoor thermographic inspection of operating PV systems. It covers inspection equipment, environmental conditions, procedure, personnel competence, and reporting, and it does not prescribe one universal module-temperature range for every PV plant.
Irradiance, wind, cloud movement, module temperature, reflections, and viewing angle all affect the usefulness of thermal data. The flight must also provide enough spatial resolution for the intended target; a module-level survey may not resolve a small cell-level feature.
Aerial thermography is therefore useful for localization and screening. It can show where the array behaves differently, but a thermal pattern alone does not prove why.
Electrical Tests That Confirm the Cause
Electrical tests are selected according to the suspected condition. An IV-curve measurement can describe current-voltage behavior across an operating range and may help identify mismatch or performance-related abnormalities that a single current or voltage measurement cannot fully characterize.
Open-circuit voltage, or Voc, can help verify string configuration and identify unexpected voltage differences. Short-circuit current can support comparison between similar strings under suitable conditions, while insulation resistance testing examines unwanted leakage paths between energized conductors and earth or other parts that should remain isolated.
Protective conductor continuity testing answers another question: whether designated conductive parts remain electrically connected through the intended protective path. It does not test module performance, but it may be relevant when physical damage or electrical work has affected bonding.
No one electrical test confirms every failure mode. A normal Voc does not prove that a connector is sound, and an acceptable insulation resistance value does not prove that a module is producing expected power. The test should match the suspected mechanism.
Electrical testing does not become unnecessary because thermography has been performed. Thermal imagery identifies temperature-related evidence, while direct electrical measurements verify electrical properties. Where the cause matters for repair, the two forms of evidence may need to be used together.
From Finding to Maintenance Decision
A useful finding must first be traceable to the correct physical component. The report should identify the module, row, string, or electrical section and preserve the evidence that led to further investigation. Visible photographs, thermal images, monitoring records, and electrical measurements should be connected to the same location where possible.
The next step is verification. If a thermal pattern suggests a module-level problem, the team can compare it with visible condition and electrical measurements. If monitoring identifies a string deviation, current, voltage, connector condition, shading, and module-level evidence may need to be checked before the cause is assigned.
Once the problem is sufficiently supported, the maintenance action can be defined. That may involve cleaning, vegetation removal, connector repair, cable work, module replacement, further diagnostic testing, or monitoring rather than immediate replacement.
The work order should preserve what was found, what was verified, and what action was taken. After corrective work, a repeat measurement or inspection can confirm whether the abnormal condition changed as expected.
This creates a traceable chain from detection to maintenance rather than treating the first abnormal signal as the completed diagnosis.
Limits
No single observation proves that a PV module is faulty in every relevant sense. A thermal pattern does not establish root cause by itself, a visual defect does not always establish electrical impact, and one electrical value does not describe the complete operating condition of a module.
A single inspection is also not continuous monitoring. Intermittent conditions can disappear before the survey, and a component that appears normal during the inspection can develop a fault later. Monitoring history and event-driven inspection remain important between scheduled visits.
Some defects may produce no useful thermal signal. Others may produce normal-looking current or voltage values under one operating condition while becoming evident only under another test or load state.
Software can organize inspection images, measurements, locations, and reports, but it does not replace electrical testing or competent interpretation.
The strongest fault diagnosis therefore comes from matching evidence to the question being asked: monitoring for where behavior changed, visual and thermal inspection for where to look, and electrical testing for the properties that need direct verification.